Recent news
The archive of the data base «Ionograms of ionosphere vertical sounding for 1970-1971 (Paratunka, Kamchatskiy kray)» has been put in order
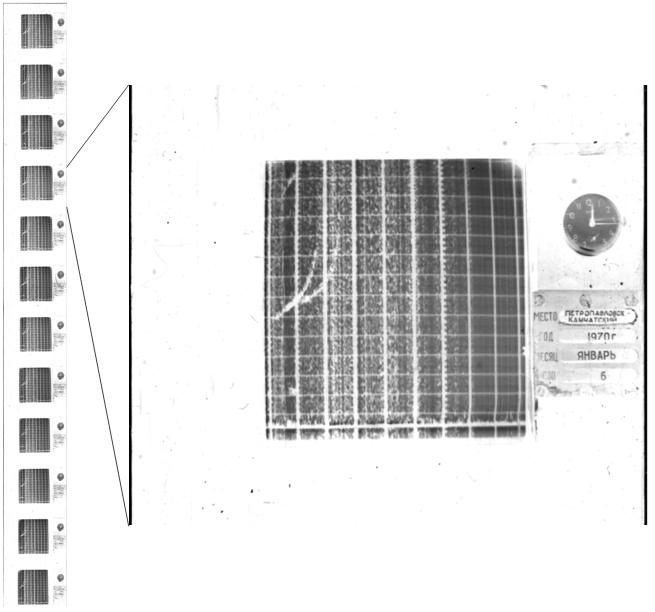
IKIR FEB RAS has an archive of ionograms of Paratunka ionospheric site located at Paratunka, Elizovskiy raion, Kamchatskiy kray (52°58'23"N, 158°14'50"E.) for the period 1968-2000. The ionograms are stored on films, which are in the process of scanning. An example of a scanned fragment can be seen on the image below.
The moment, ionograms, scanned from the films, in the form of jpeg. files are available for the period 1968-1071. When it is needed for scientific purposes, ionograms are digitized to determine the following characteristics:
1. fmin – the least frequency at which reflection traces from the ionosphere are observed on the ionogram.
2. foE – the critical frequency of O-component of the lowest thick layer in E region.
3. foF1 – the critical frequency of O-component reflected from F1 layer.
4. foF2 – the critical frequency of O-component reflected from the highest detachment in F layer region and from the whole F region when there is no separation of F region into F1 and F2 layers.
5. fxF2 – the critical frequency of X-component reflected from F2 layer (or F region).
6. fxI – the highest frequency of X-component on which there are reflections from F region weather they are reflected from the ionosphere overhead or inclined.
7. foЕs – the cut-off frequency of O-component reflected from the sporadic layer, Es layer.
8. fbEs – the shielding frequency of Es layer, i.e. the least frequency on which O-component first-order reflections for a higher layer are observed.
9. h’E – the minimum effecting height of the normal E layer. минимальная действующая высота.
10. h’F – the minimum effecting height of O-component reflection trace from F region taken as a whole (that is the F1 layer height when separating the F region into F1 and F2 layers).
11. h’F2 – is the minimum effecting height from F2 layer (where the region F is separated into F1 and F2).
12. hpF2 – is the effective height of O-component reflection trace at the frequency 0,834*foF2. This height is equal to the real height of F2 layer electron concentration maximum.
13. h’Es – the minimum effective height of the trace used to determine foEs.
14. M3000F1 – is the coefficient showing the ratio of the maximum usable frequency (MUF), reflected from F1 layer during a high dip at the distance equal to 3000, to the critical frequency foF1.
15. M3000F2 – is the coefficient showing the ratio of the maximum usable frequency (MUF), reflected from F2 layer during a high dip at the distance equal to 3000, to the critical frequency foF2.
16. Determination of sporadic layers Es types.
17. Determination of F-scattering types.
The data base obtained a State registration certificate No. 2022620875.